With battery-stats you can collect and save data your laptop battery provides. Although there are some tools in the package to plot collected data, the most important, in my opinion, is missing. Below you can find a program to plot the battery levels saved each time battery is full and a power cord is disconnected. You can see, that as time passes the battery can hold less and less charge.
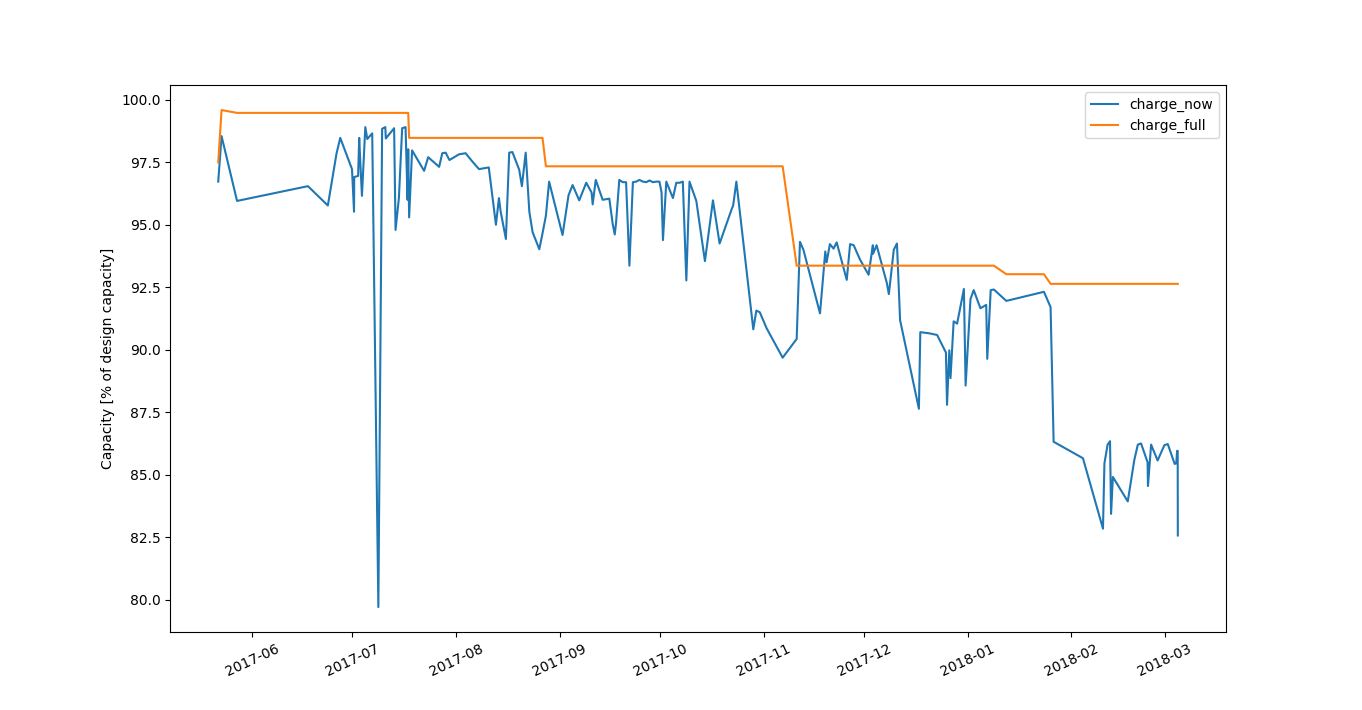
Figure 1: My battery loosing its capacity
#!/usr/bin/python3

from datetime import datetime
import matplotlib.pyplot as plt
import matplotlib.dates as md
import csv

charge_full_design = None
data = []
x = []
y1 = []
y2 = []

with open("/var/log/battery-stats.csv") as csvfile:
    csvreader = csv.DictReader(csvfile, delimiter=',', quotechar='"')

    last_state = None
    for row in csvreader:
	charge_now = int(row['charge_now'])
	charge_full = int(row['charge_full_design'])
	state = None

	if charge_full_design is None:
	    charge_full_design = int(row['charge_full_design'])

	if state is None:
	    state = row['status']

	if charge_now == charge_full:
	    last_state = 'Full'
	    continue
	elif row['status'] == 'Discharging' and charge_now < charge_full:
	    state = 'Discharging'
	else:
	    continue

	if state == 'Discharging' and last_state == 'Full':
	    #print('{timestamp}\t{charge_now}t{charge_full}'.format(**row))
	    #data.append((int(row['timestamp']), charge_now, int(row['charge_full'])))
	    x.append(datetime.fromtimestamp(int(row['timestamp'])))
	    y1.append(float(100*charge_now/charge_full_design))
	    y2.append(float(100*int(row['charge_full'])/charge_full_design))
	last_state = state

plt.plot(x,y1,x,y2)
plt.ylabel("Capacity [% of design capacity]")
plt.xticks(rotation = 25)
plt.legend(['charge_now', 'charge_full'])
plt.show()